Why we monitor the extent of freshwater wetlands
Wetlands are an important storehouse of indigenous biodiversity. Native plants and animals, and the wetland ecosystems they form, are valued for their unique genetic diversity, cultural and spiritual importance, scientific interest, recreational opportunities and intrinsic values. In addition, wetlands provide many environmental services, improving water quality, storing carbon, and reducing the effects of floods.
Yet wetlands are a severely depleted and often degraded ecosystem type. Nationally an estimated 90 per cent of the pre-human extent of wetlands has been cleared and drained1.
The Waikato region remains a North Island strong-hold with an estimated 7-8 per cent of its original (pre-human) freshwater wetland vegetation extent remaining (compared with 5 per cent for the North Island as a whole)1. An estimated 44 per cent of all of the North Island’s remaining freshwater wetlands occur in the Waikato region1, which also has three of New Zealand’s seven Ramsar Wetlands (sites of international significance).
Change in the extent of remaining wetlands may affect the diversity and security of native species.
This indicator describes and quantifies the spatial extent and distribution of freshwater wetland vegetation and how that has changed over time. Waikato Regional Council uses the Land Cover Database (LCDB) to monitor current freshwater wetland vegetation. Landcare Research have estimated pre-human1 extent of freshwater wetlands in the Waikato region.
Monitoring trends in the type, location, and extent of freshwater wetland vegetation gives us valuable information on how well we are maintaining our region's unique freshwater biodiversity.
Monitoring wetlands helps us to:
- find out where wetland areas have been lost (for example through drainage), or gained (for example through wetland creation on retired pasture)
- gain information on where land use pressures are occurring, to help us identify policy responses to avoid or reverse adverse effects on wetland biodiversity
- find out what geographic areas have lost the greatest amount of freshwater wetland
- measure the spread of invasive canopy species such as grey or crack willow.
The monitoring outcomes can therefore guide adaptive management and policy decisions for biodiversity management planning.
What's happening?
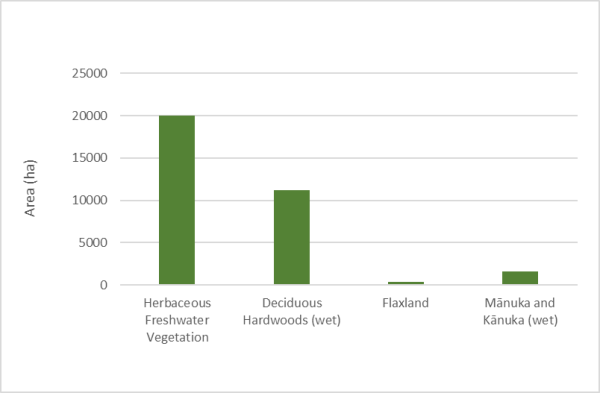
Before human arrival it is estimated that about 356,516 hectares of freshwater wetland vegetation occurred in the Waikato region1 (15 per cent of the region’s land area, excluding large open water bodies).
Swamps and marshes comprised over 70 per cent of the pre-human freshwater wetland extent1, with the extensive raised bogs and associated fens in the Hauraki Plains and Hamilton Basin contributing most of the balance. Today, less than 10 per cent of those pre-human wetlands remain, with swamps and marshes the most significantly affected, and now comprising just over half of the total area of freshwater wetland1. While bogs fared somewhat better, having been reduced by 81 per cent compared with the 95 per cent loss of swamps and marshes and over 99% of fens1, the former Komakorau, Rukuhia and Moanatuatua bogs have been reduced to small fragments. The largest remaining areas, Kopuatai Peat Dome and Whangamarino Wetland, are internationally significant.
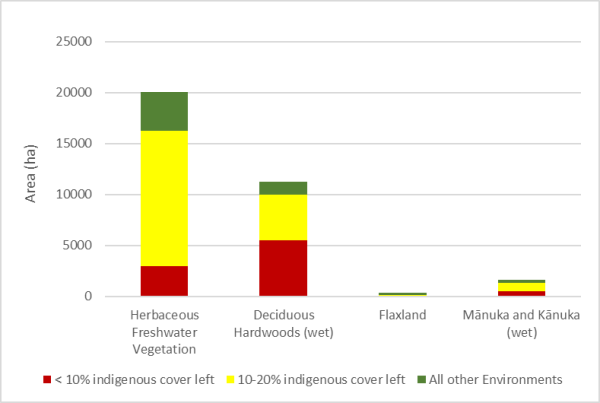
Eighty three per cent of the remaining areas of freshwater wetland in the Waikato Region occur within the most threatened environments (Category 1 and 2).
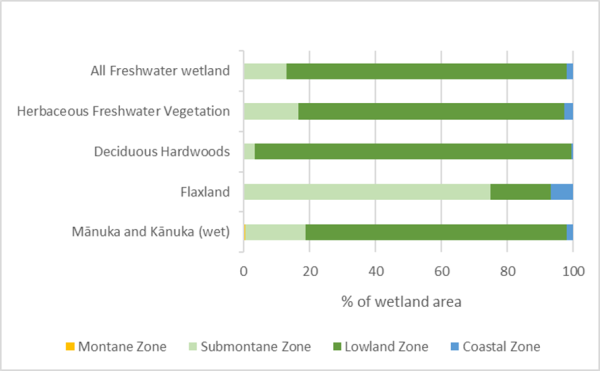
Freshwater wetlands occur mostly in lower elevations, with 85 per cent of the current extent found in the lowland bioclimatic zone. Flaxland tends to occur at higher elevations, with 75 per cent of the remaining Flaxland in the Submontane Zone (300 to 800 m elevation)
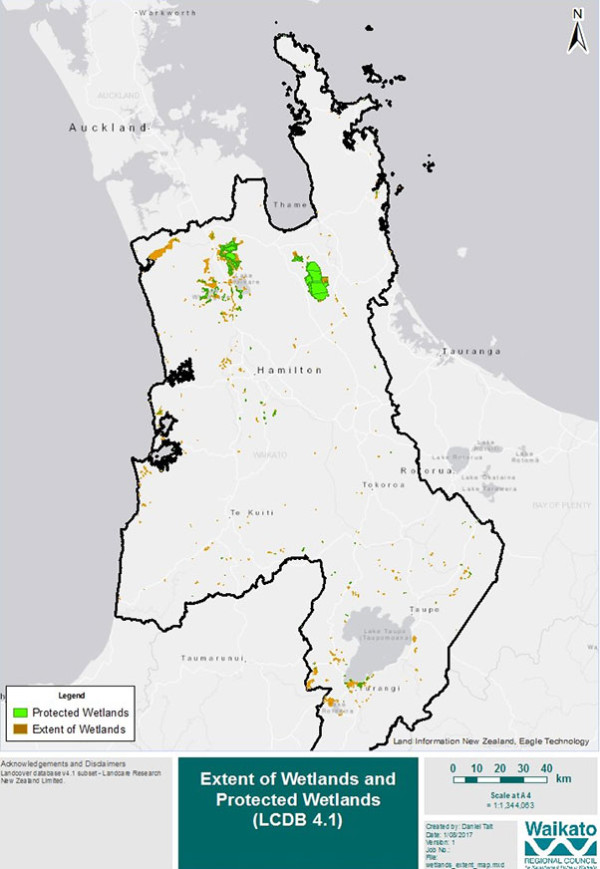
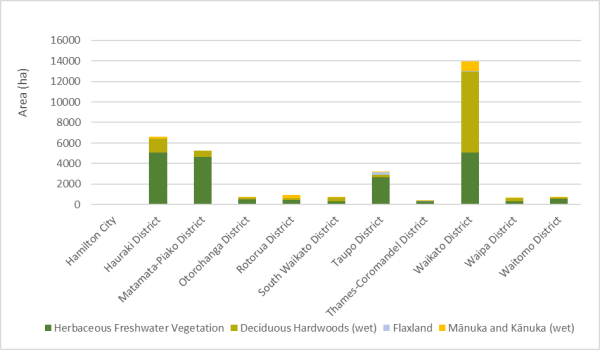
The Waikato, Hauraki and Matamata-Piako districts collectively hold 78 per cent of the region’s extent of freshwater wetland. Extensive areas remain in the lower Waikato Valley and Hauraki Plains, where the internationally significant Ramsar wetlands (Kopuatai Peat Dome and Whangamarino Wetland) are found.
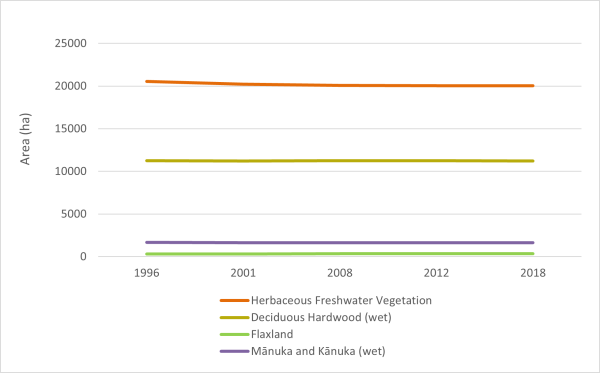
Between 1996 and 2018 the total area of freshwater wetland vegetation was reduced by 503 hectares. However, some of the losses were transition to another wetland habitat type, such as Lake & Pond.
In terms actual loss of wetland habitat, the LCDB records the conversion of 459 hectares of freshwater wetland vegetation to dryland land cover. This comprises the conversion of 416 hectares of Herbaceous Freshwater Vegetation (HFV), 25 hectares of wet Mānuka &/or Kānuka (MK), and 18 hectares of wet Deciduous Hardwood (DH). Most of these areas were converted to pasture. The average annual rate of loss of freshwater wetlands to developed land since 1996 is 20 hectares. This has slowed in the past five years to 6 hectares per year on average, with a recorded loss of 36 hectares of freshwater wetland types to dry land.
In contrast to the loss of freshwater wetland since 1996, the gains have amounted to an average 2 hectare per year from pasture or cropping land, with no gains from developed land since 2012, although some restoration projects during that time may be of insufficient scale or stage of maturity to show up on the Land Cover database.
Results - data and trends
This Excel spreadsheet contains the source data for this indicator's graph and information.

Methods - how we monitor
More information
When this indicator is updated
Updates will happen as new (region-wide) vegetation/cover spatial layers become available. It is estimated that this will be updated every five years.
Last updated July 2022
Footnotes
1. Ausseil A-G, Gerbeaux P, Chadderton WL, Stephens T, Brown D, Leathwick J 2008. Wetland ecosystems of national importance for biodiversity: criteria, methods and candidate list of nationally important inland wetlands. Landcare Research Contract Report LC0708/158. 174 p